Feed statistics
Each feed has a feed statistics area on its dashboard. Open a feed from My Feeds — below the settings form you will see charts for feed views, post captures, and average response times, plus chips for daily viewers and daily posters.
These numbers help you understand how people find your feed, how much content it is picking up, and how quickly Bluesky Feed Creator answers when the Bluesky app asks for your posts.
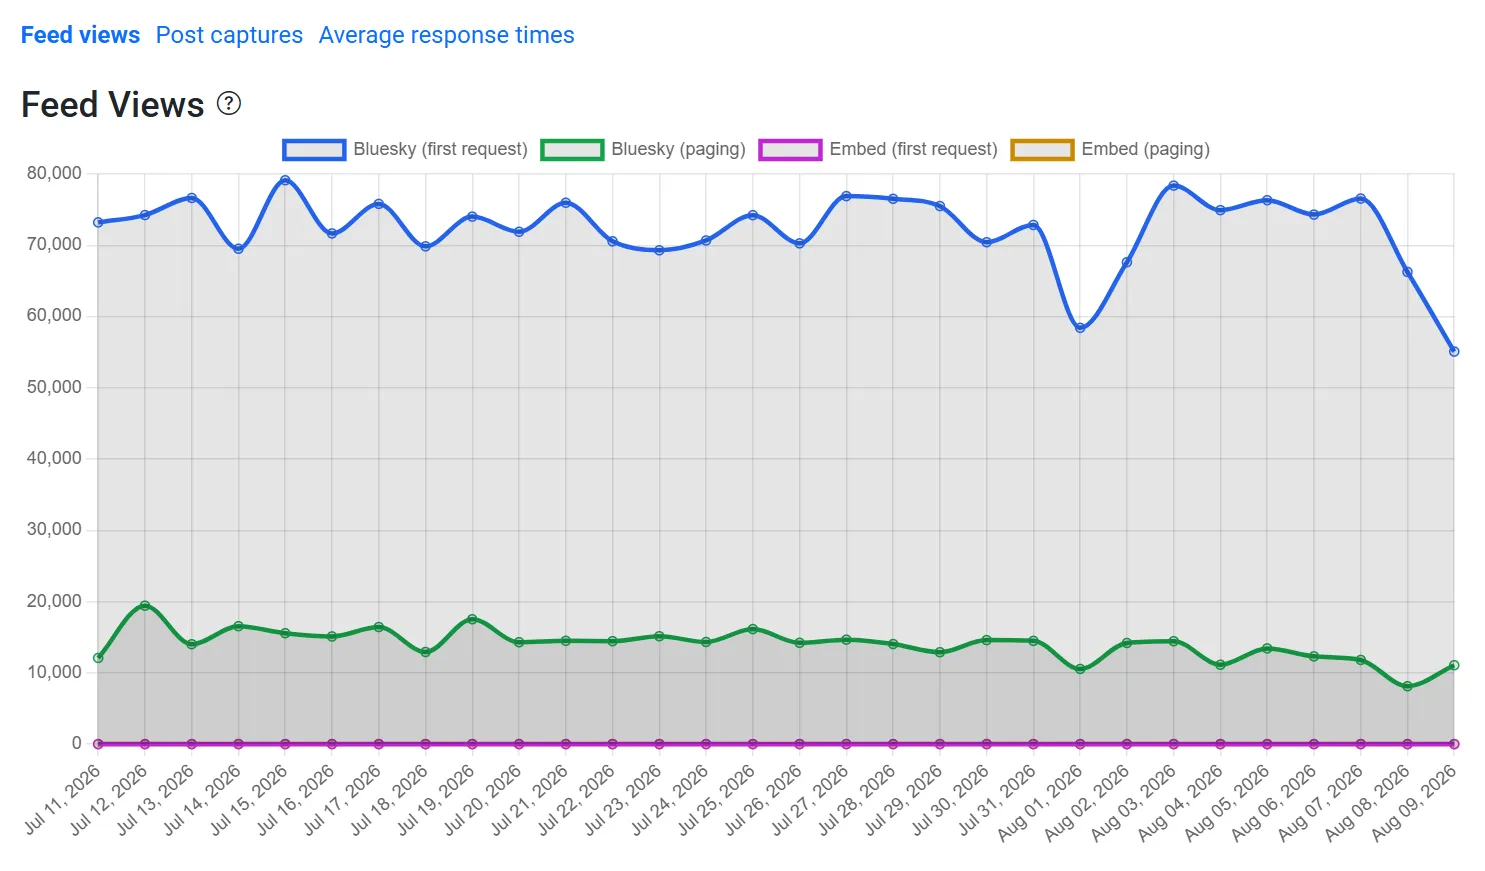
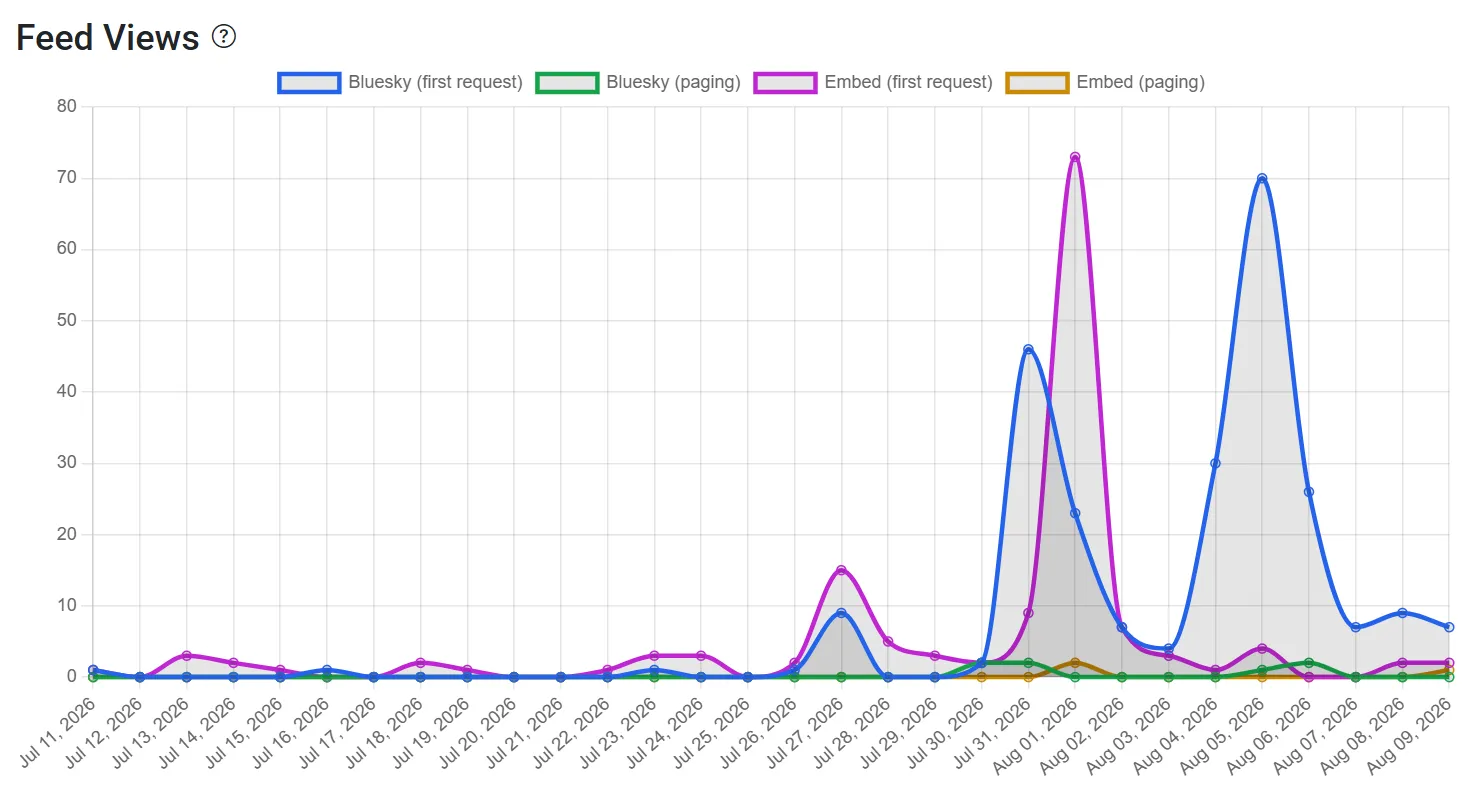
Feed views
Section titled “Feed views”This chart shows how often your feed was loaded:
- Bluesky — counts when the Bluesky app loads your feed.
- Embed — counts activity from your public embed (including searches in the embed).
There is no delay for this chart, so the current day usually looks lower until the day is finished.
For how views relate to your plan and usage limits, see Plans and usage. For embedding your feed on a website, see Embedding a feed on your website.
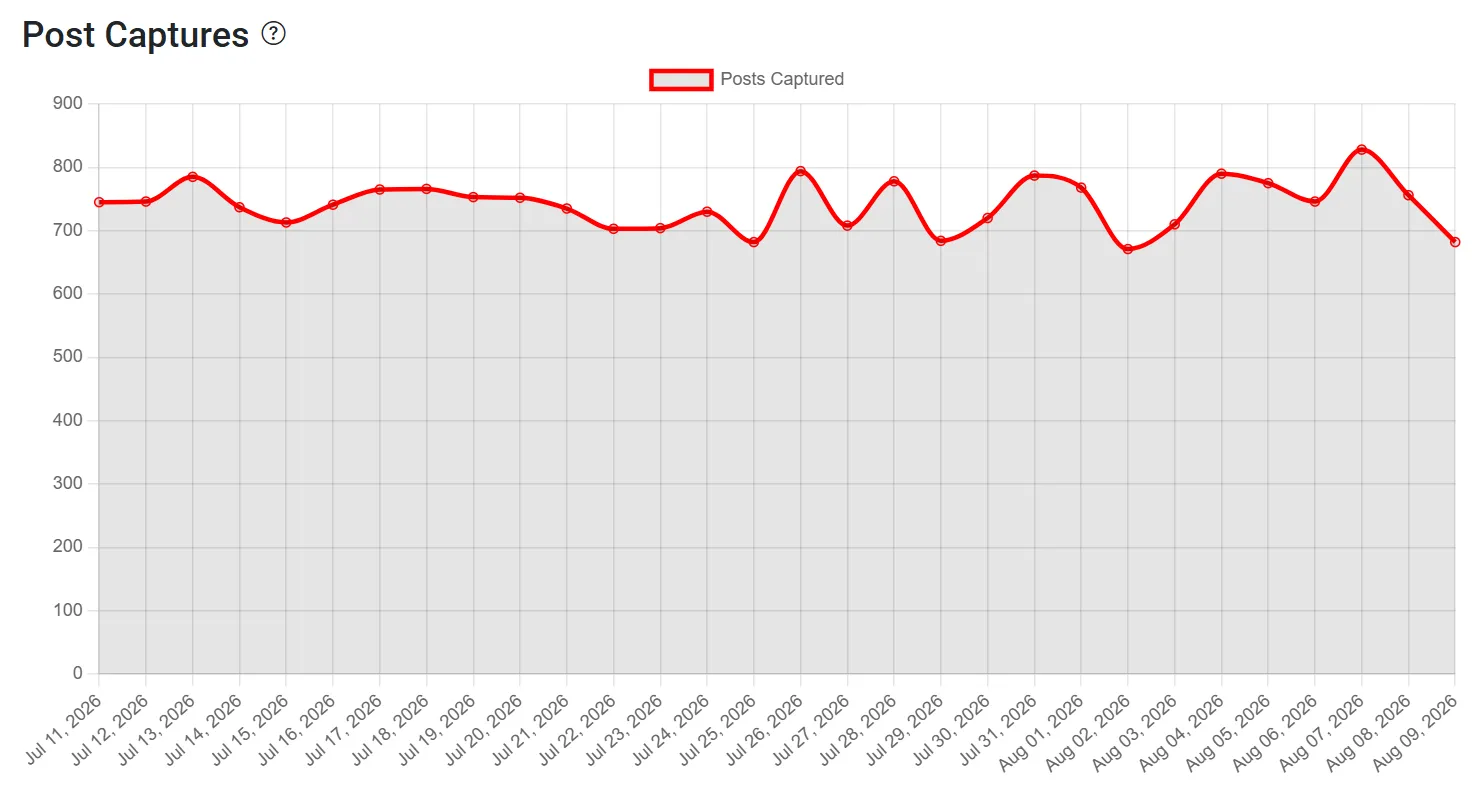
Post captures
Section titled “Post captures”Whenever a post from the firehose matches your feed settings and is saved, it is counted here.
Like feed views, there is no delay for this chart, so the current day will show fewer captures until the day completes.
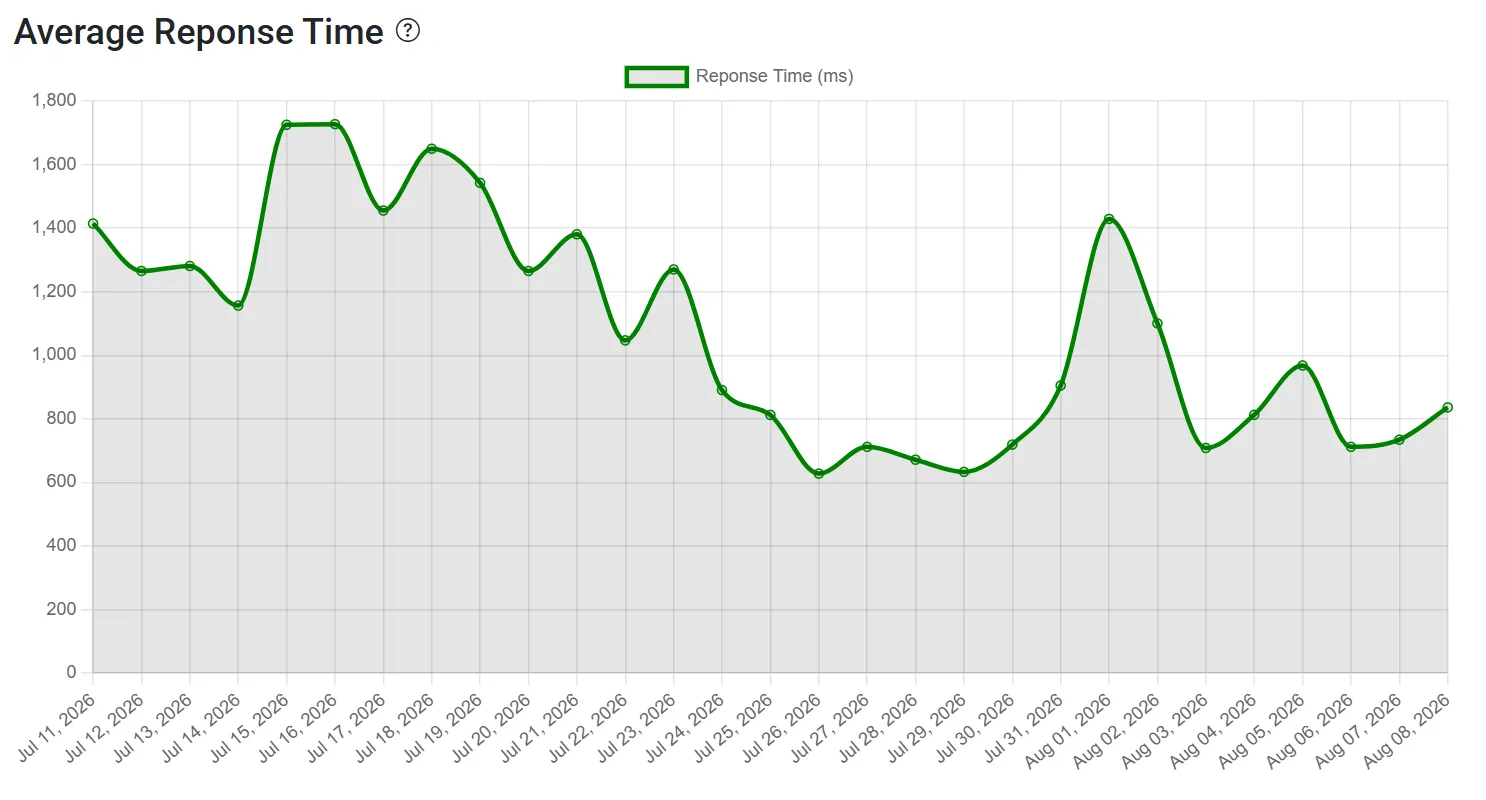
Average response times
Section titled “Average response times”This is the time it takes Bluesky Feed Creator to reply with your feed’s posts when the Bluesky app asks for them. Lower is better for a snappy experience in the app.
Only whole days are shown, so there is about a 24-hour delay before a day’s average appears.
Daily viewers
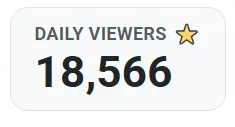
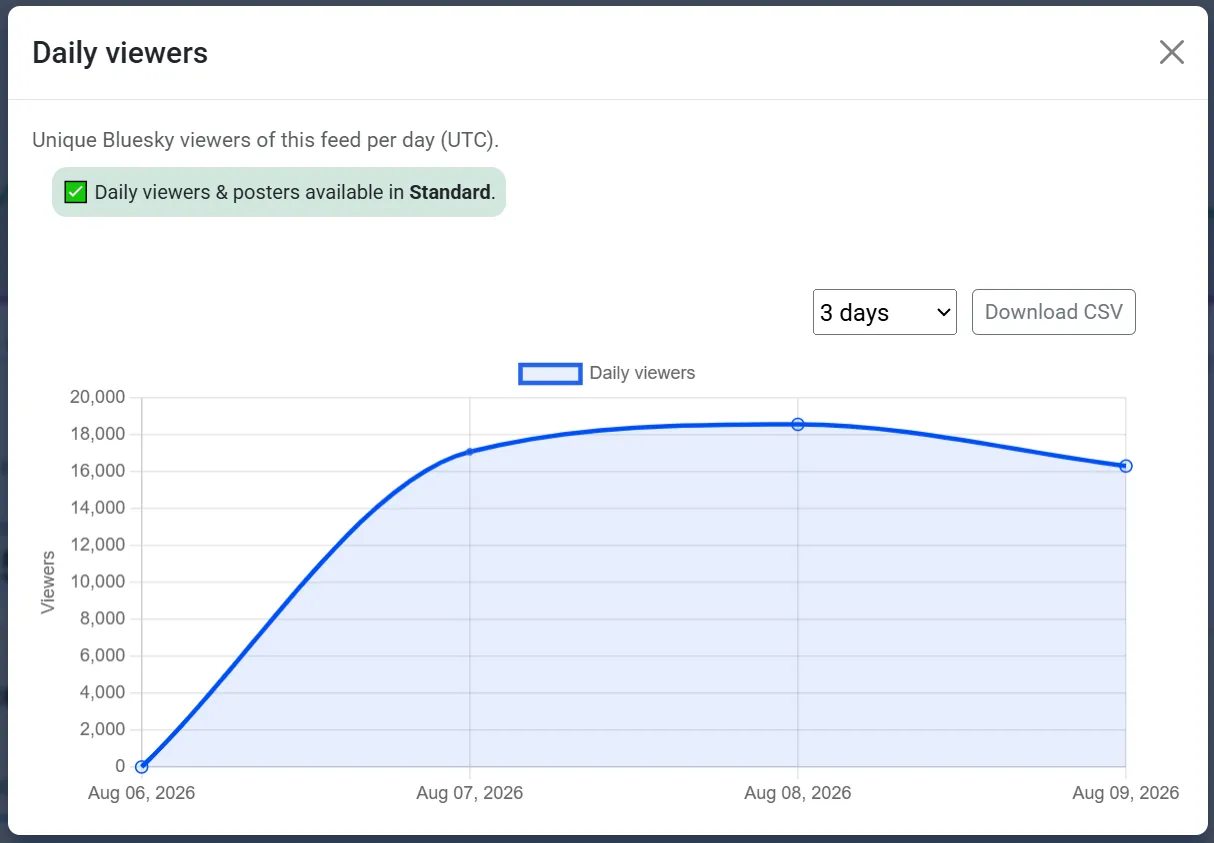
Section titled “Daily viewers”Under the charts, the Daily viewers chip shows how many unique people loaded your feed on a day (UTC).
Click the chip to open a history graph. You can switch the window between 3, 7, 14, 30, 60, and 90 days.
Daily posters
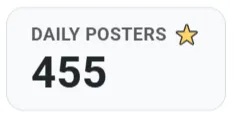
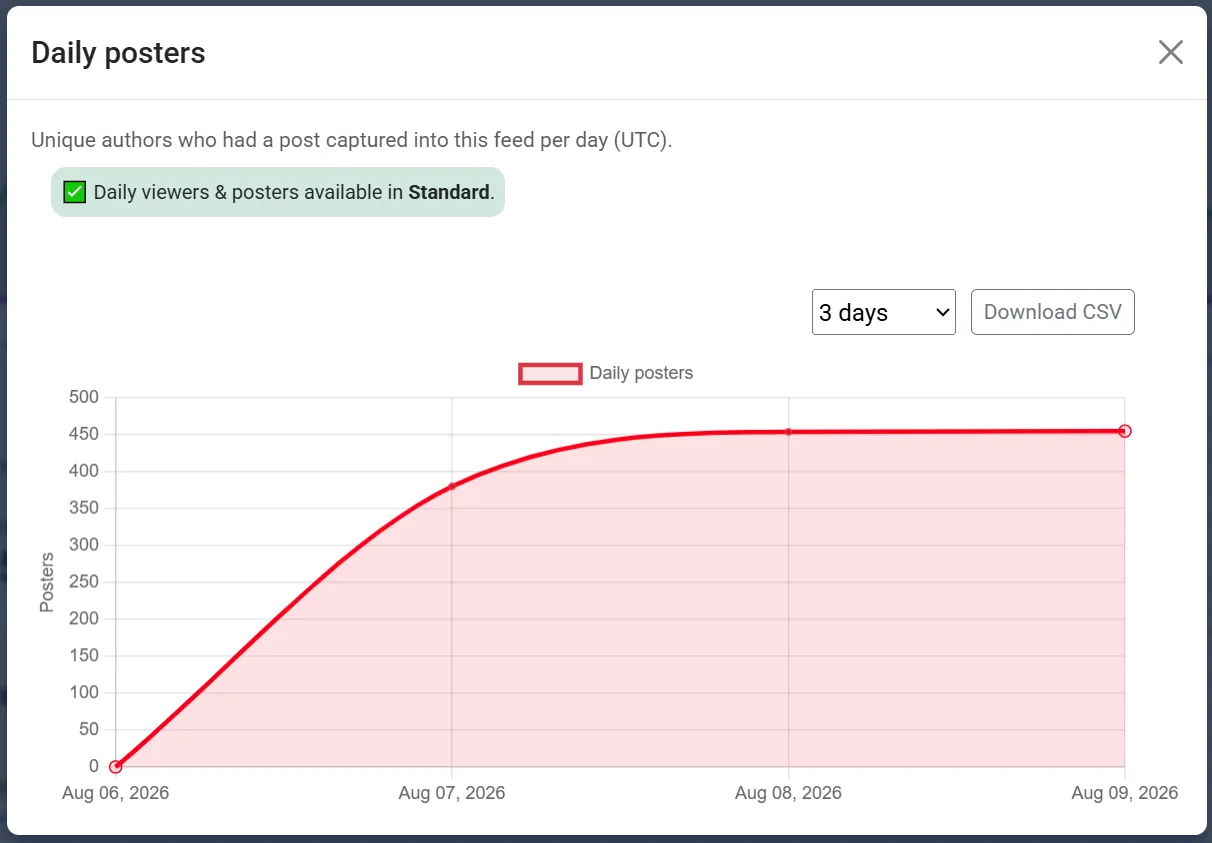
Section titled “Daily posters”The Daily posters chip works the same way for unique authors whose posts were captured into your feed that day (UTC).
Click it for a day-by-day history graph with the same time-window options as daily viewers.
Related
Section titled “Related”- Embedding a feed on your website — Bluesky vs Embed in the viewing statistics section
- Plans and usage — how feed views relate to billing and plan limits
- Populating a new feed — getting posts into a new feed so capture stats start moving